Reference / Where the correction acts
Model option
Before the cell temperature
The correction on the effective irradiance, the cell temperature from the corrected irradiance
Inputs used: Spectral application, Spectral air mass, Air-mass cap, Station pressure, Altitude
Method
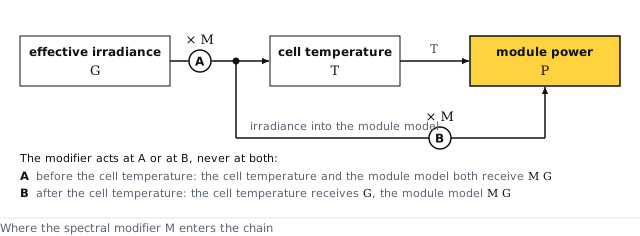
The irradiance is multiplied by before the cell temperature step, point A of Figure 10. The cell temperature, the module power, the electrical shading and the irradiance-level and temperature rows of the loss diagram are all computed from the corrected irradiance . The spectral row is the change of the array's nominal power, the nameplate power scaled by the irradiance, between and . The air mass is the Kasten and Young 1989 relative air mass scaled by the air pressure, floored at 0.58 and capped at 10 unless the Physics tab sets another cap.
Settings
| Setting | Value |
|---|---|
| Relative air mass | Kasten and Young 1989 |
| Altitude factor | , with the weather file's air pressure, else the standard-atmosphere pressure at the site elevation, in mbar |
| Air-mass cap | 10; the air-mass cap on the Physics tab when it is set |
| Irradiance the cell temperature is computed from | , after the correction |
| Power the spectral row is measured on | , the module's nameplate power scaled by the irradiance |
The math
- Air mass
- Spectral modifier
- Module power
- Spectral row
where
| Symbol | Meaning | Unit |
|---|---|---|
| the air mass: the path length of the sunlight through the atmosphere relative to a vertical path at sea level | — | |
| the altitude factor of the air mass, from the air pressure | — | |
| the relative air mass of Kasten and Young 1989 | — | |
| the air-mass cap on the Physics tab; 10 when it is empty | — | |
| the air pressure: the weather file's value, else the standard-atmosphere pressure at the site elevation | mbar | |
| the elevation of the sun above the horizon | degrees | |
| the spectral modifier of the timestep, a factor near 1 | — | |
| the six coefficients of the module's cell technology | — | |
| the precipitable water, held between 0.1 and 8 cm | cm | |
| the array power at its maximum-power point, before the electrical shading and the flat derates | W | |
| the number of modules | — | |
| the maximum power of one module at irradiance and cell temperature | W | |
| the effective irradiance on the modules before the correction, with the rear side's share on a bifacial array | W/m² | |
| the cell temperature | °C | |
| the cell-temperature model of the Cell temperature step, as a function of the front irradiance | °C | |
| the front irradiance the cell temperature is computed from, before the correction | W/m² | |
| the power the spectral correction removes at the timestep, the spectral row of the loss diagram; negative when exceeds 1 | W | |
| the module power the spectral row is measured on, at irradiance | W | |
| the nameplate power of one module | W | |
| the irradiance of standard test conditions, 1000 W/m² | W/m² |
References
- Lee & Panchula 2016, Spectral correction for photovoltaic module performance based on air mass and precipitable water, IEEE 43rd Photovoltaic Specialists Conference
- Kasten & Young 1989, Revised optical air mass tables and approximation formula, Applied Optics 28(22) 4735–4738
API
spectral.application = effective_irradiance, spectral.airmass_method = kasten_young_1989
Symbols follow the symbol registry.